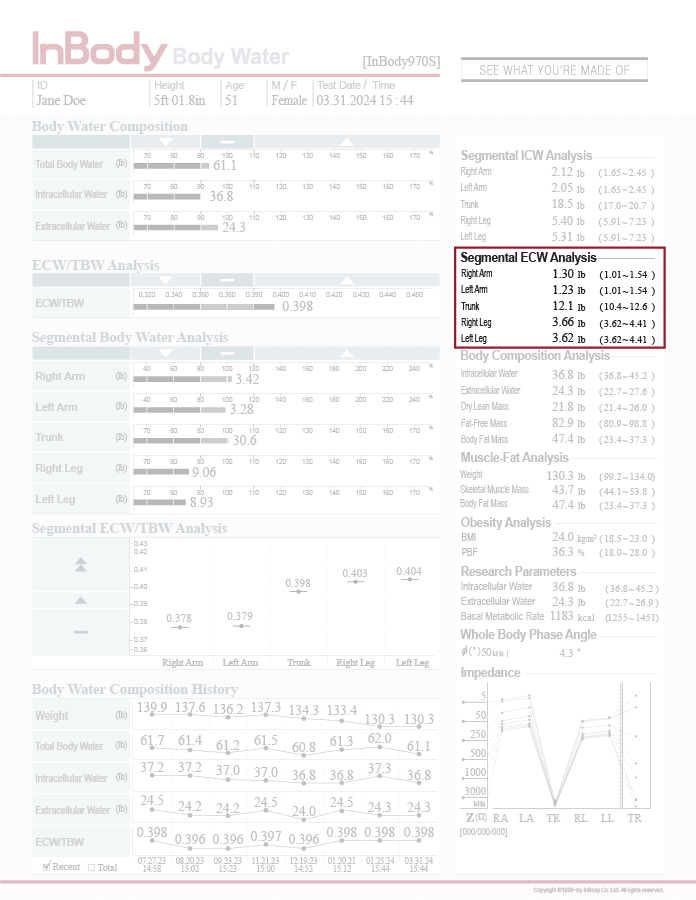
The InBody Result Sheet displays your body composition measurements in a clear, easy-to-read way to make understanding your results simple.
Below, you will find a concise breakdown of each section of the Result Sheet. You’ll learn what each measurement means, why it matters, and how it can help you be successful in your health journey.
* The information provided is to be used for educational/informational purposes only and does not constitute medical advice. Only certified medical & health professionals may diagnose patients and provide such advice.
Chapter 1
Body Composition Analysis & Body Water
Body Water Composition
Shows the Total Body Water within the body, divided into Intracellular Water and Extracellular Water. Intracellular Water (body water inside cells) and Extracellular Water (body water outside cells) make up Total Body Water.
Body Composition Analysis & Body Water
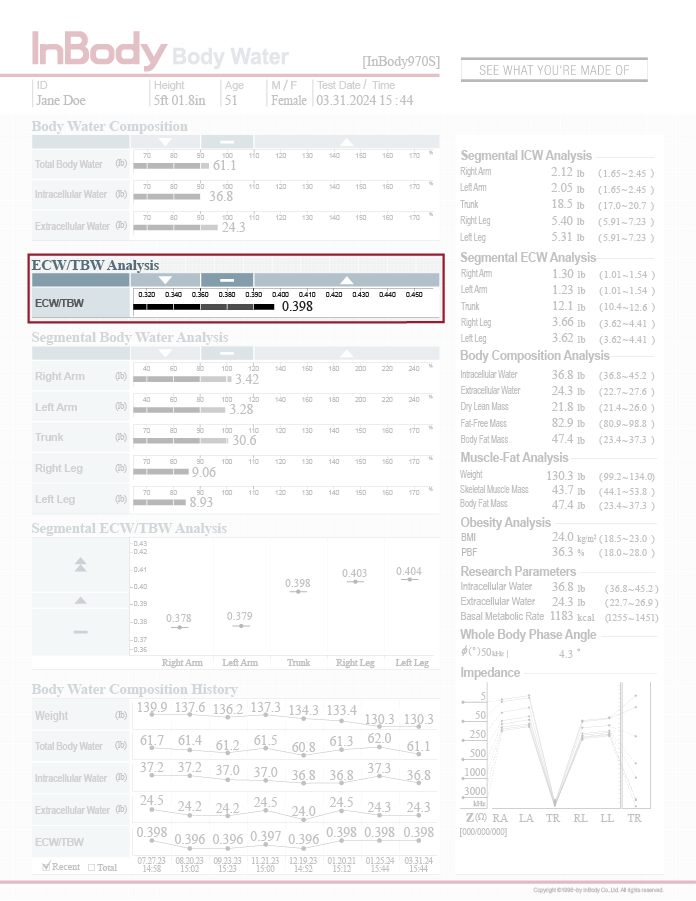
ECW/TBW Analysis
ECW/TBW is a measure of compartmental fluid distribution and shows, as a ratio, how much of your total body water is extracellular.
Taking multiple InBody Tests will establish your normal fluid status and help determine any imbalances. As a general guide, check to see that your ECW/TBW is below 0.390.
WHY THIS MATTERS
This graph lets you quickly understand if you have occasional inflammation or swelling in your body resulting from strenuous exercise or activity. You can also use this to give context to LBM. High LBM and a high ECW/TBW ratio usually indicate excess body water—not just muscle.
Chapter 2
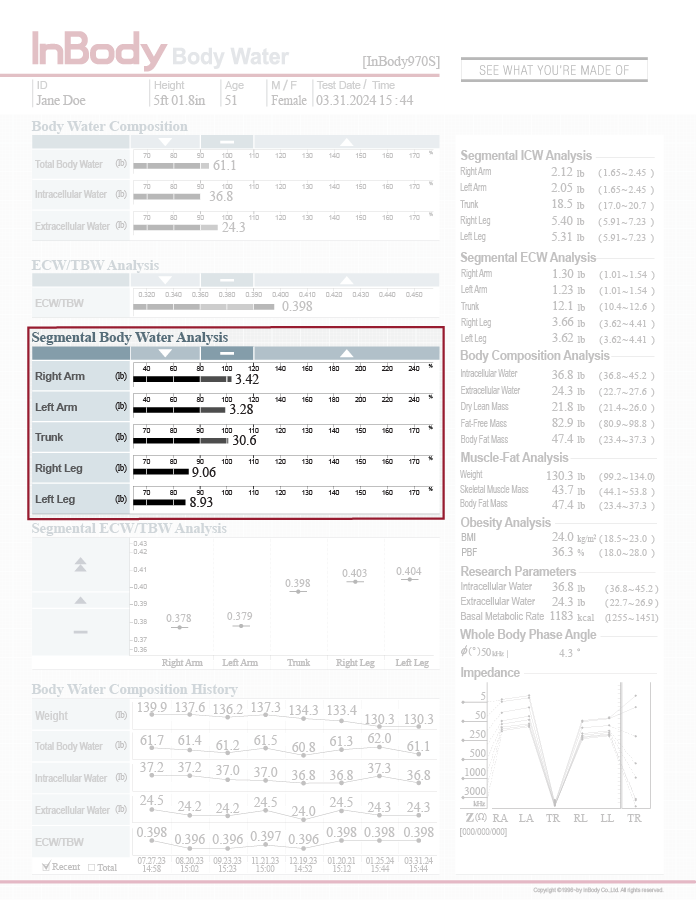
Segmental Body Water Analysis
This section shows how much intracellular and extracellular body water (lb or L) is contained in each of the body’s five segments. Health professionals can use this output to evaluate body water distribution
Segmental ECW/TBW Analysis
This graph displays the ECW ratio in each of the body’s five segments. Caregivers can use this data to more precisely identify the location of fluid retention and fluid imbalances in each segment. It is also important to note that since Extracellular Water is a part of Fat-Free Mass, an elevation of ECW/TBW can increase Fat-Free Mass in that segment. Because of this, any imbalances in the Segmental Lean Analysis should be evaluated for a difference in segmental ECW/TBW to determine if the cause of the imbalance is due to fluid retention rather than muscular imbalance.
WHY THIS MATTERS
With chronic inflammation, it is crucial to prevent disease progression and treat the current state of inflammation. Increases in segmental ECW/TBW may be indicative of poorer health status. Therefore, tracking changes in segmental ECW/TBW can be used to monitor injuries, disease progression, and recovery.
Body Composition History
This graph displays some of the most vital measurements from your previous tests (up to 8). With Body Composition History, you can easily spot trends and track your progress over time.
At the bottom of the Result Sheet is the Body Composition History graph, which automatically tracks your Weight, Skeletal Muscle Mass, Percent Body Fat, and ECW/TBW measures from recent tests.
The purpose of this graph is to let you monitor positive and negative changes in body composition so you can adjust your diet and exercise plan to get the results you desire.
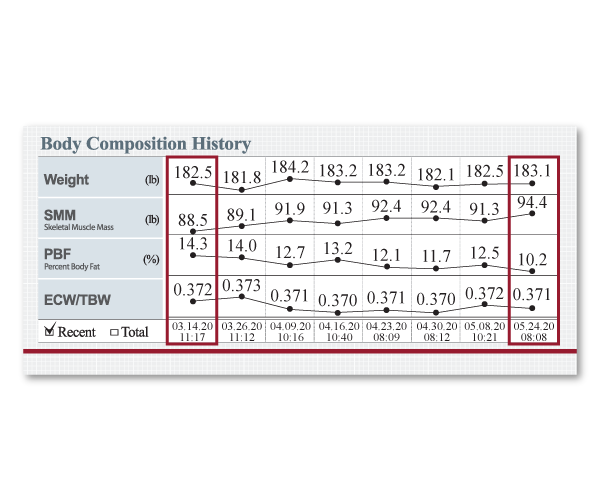
Let’s examine how to track positive and negative body composition changes by looking at the example above. These results represent an athletic, D-shaped individual whose goal was to gain muscle and lose body fat.
Tracking positive change
The Body Composition History graph makes it easy to spot when positive body composition changes occur. For instance, a gradual increase in Skeletal Muscle Mass and decrease in Body Fat Mass over the past few tests indicates that you’ve made excellent progress towards improving your overall body composition.
WHY THIS MATTERS
By any measure, this indicates that you are on the right track to achieve your goals. You should continue to follow your diet and exercise routine and closely monitor your progress using Body Composition History.
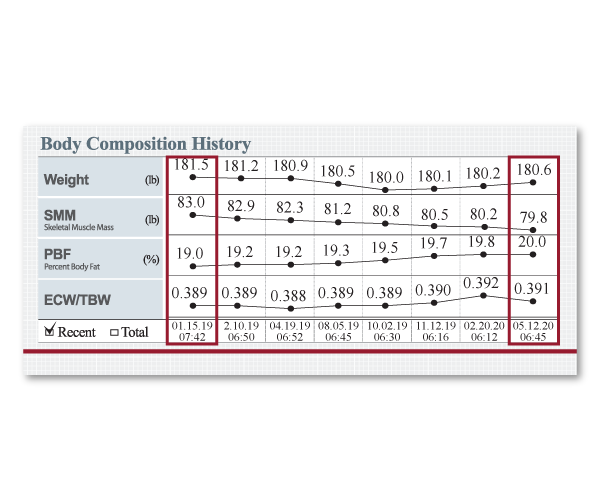
Tracking negative change
The Body Composition History graph also makes it easier to spot negative body composition changes. For example, a drop in body weight may initially appear like a positive change, but regular testing may show that this trend was due to muscle loss, not fat loss.
WHY THIS MATTERS
A graph like this can be a real eye-opener because it shows that negative body composition changes can occur if your weight remains the same or even decreases for the wrong reason.
If your graph looks like this, you need to retain your muscle mass with some combination of nutrition and strength training.
Customizable Outputs
On the right-hand side of your Result Sheet, you will find a series of additional outputs. The InBody Test administrator can customize these outputs based on your specific goals.
Segmental ICW & ECW Analysis
Intracellular Water (body water inside cells) and Extracellular Water (body water outside cells) make up Total Body Water. Both ICW and ECW are important to monitor, but assessing Extracellular Water, in particular, can provide deep insights.
WHY THIS MATTERS
In both Segmental ECW and ICW Analysis, data comparison ranges for each segment are provided to help healthcare professionals compare patients’ results to the healthy average.
Customizable Outputs
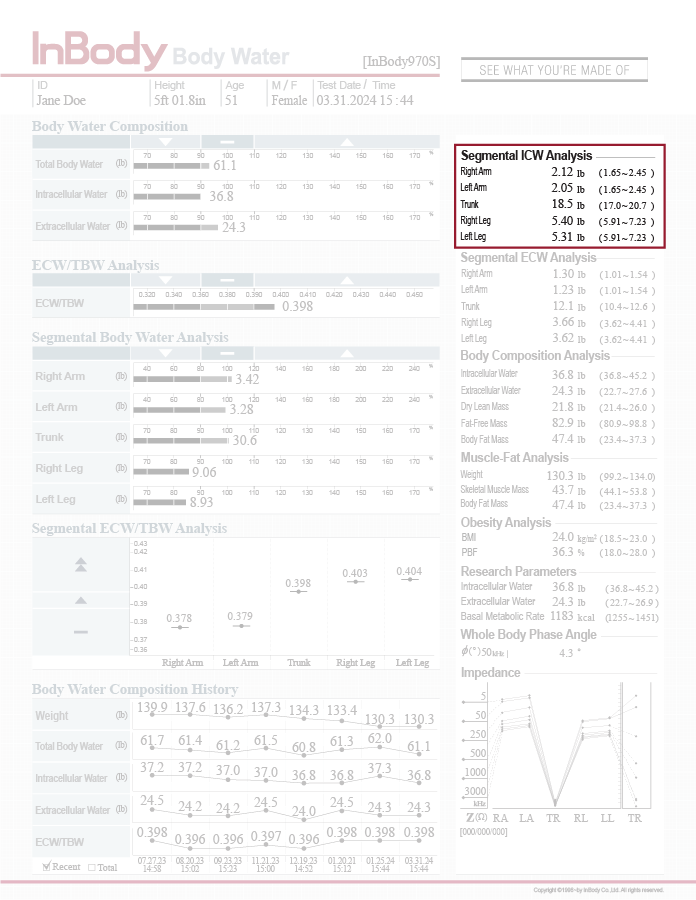
Segmental ICW Analysis
Segmental ICW Analysis reveals segmental differences in muscle. High ICW is a marker of healthy, metabolically active muscle. Segmental ICW can help assess which regions have better muscle mass/hydration.
WHY THIS MATTERS
Comparing ICW in the right and left limbs can help detect imbalances (that may occur from favoring one side during exercise) and is helpful for personal training, physiotherapy, and injury prevention.
Customizable Outputs
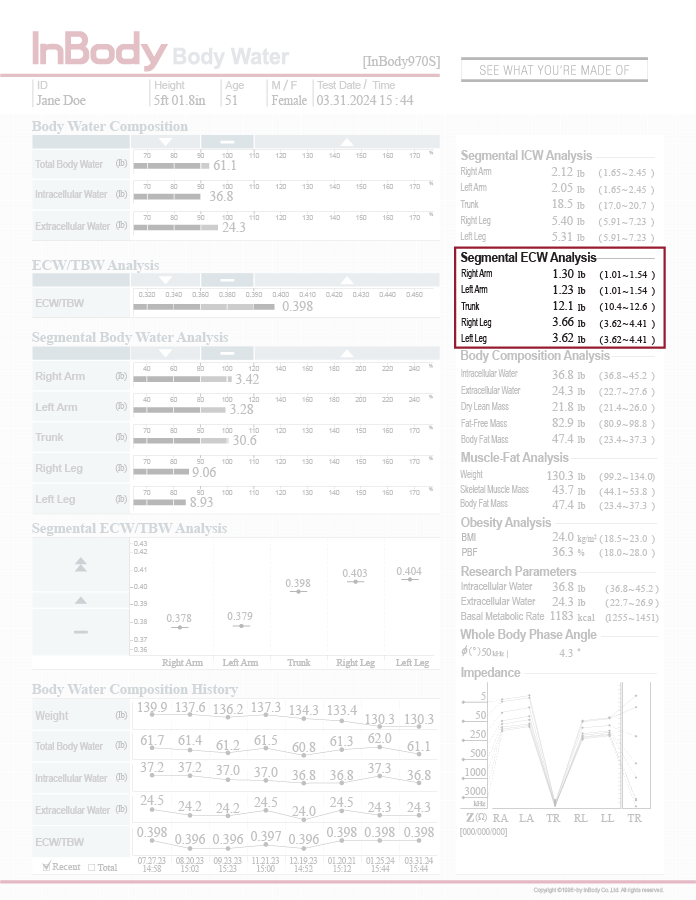
Segmental ECW Analysis
Segmental ECW Analysis reveals whether segmental water retention is present. High segmental ECW, especially when localized (e.g., in one leg), can indicate Lymphedema, insufficiency in blood/water flow in the area, over-training or injury, or post-surgical swelling. Localized increases in ECW may point to inflammation, trauma, or infection in that body segment.
Customizable Outputs
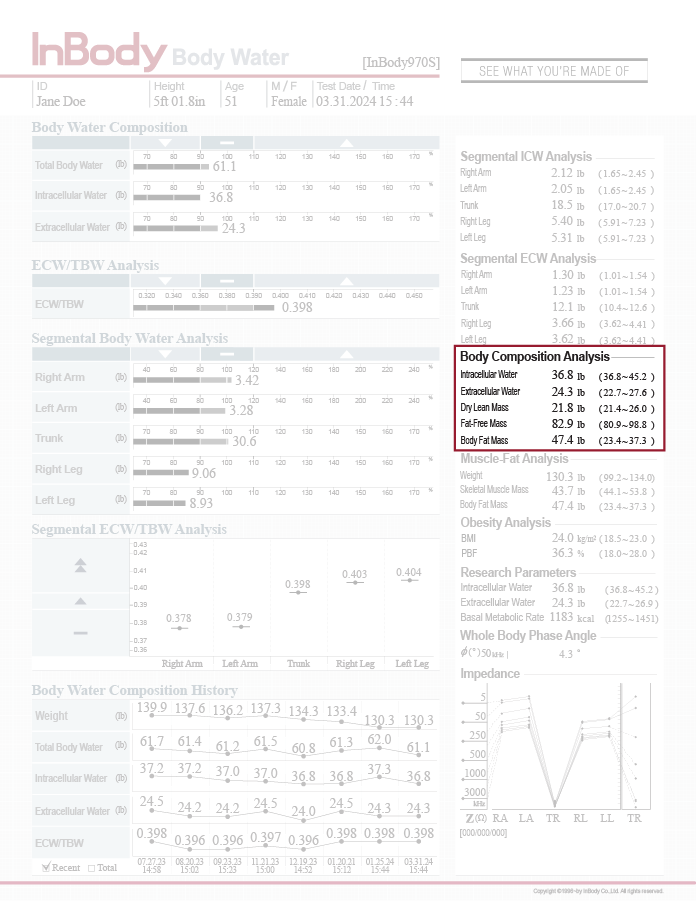
Body Composition Analysis
Intracellular and Extracellular Water
At the top, you have Intracellular Water (body water inside cells) and Extracellular Water (body water outside cells), which make up Total Body Water.
WHY THIS MATTERS
Both ICW and ECW are valuable in their own right, but monitoring Extracellular Water, in particular, can provide deep insights. If you notice an increase in ECW, but not ICW, this could be due to acute inflammation from overtraining.
Dry Lean Mass
This value is the weight of the protein and mineral content in your body.
WHY THIS MATTERS
Because protein makes up most of your muscle, and Dry Lean Mass excludes body water, if your Dry Lean Mass increases, then this is generally a sign that you have gained muscle mass!
Customizable Outputs
Body Composition Analysis
Fat Free Mass
Lean Body Mass (LBM) is the sum of your ICW, ECW, and Dry Lean Mass. LBM is the weight of everything in your body except fat; for this reason, it is also called Fat-Free Mass. Lean Body Mass includes muscle, water, bones, and organs.
WHY THIS MATTERS
Usually, increases in LBM reflect an increase in muscle mass (which you can also see as an increase in Dry Lean Mass) and is considered an improvement in body composition. However, people who do not maintain normal body water ratios may have increased LBM due to swelling caused by strenuous exercise or activity.
Body Fat Mass
Below Dry Lean Mass is Body Fat Mass. This value reveals how much body fat, both surface level (subcutaneous) and internal (visceral), makes up your weight.
Customizable Outputs
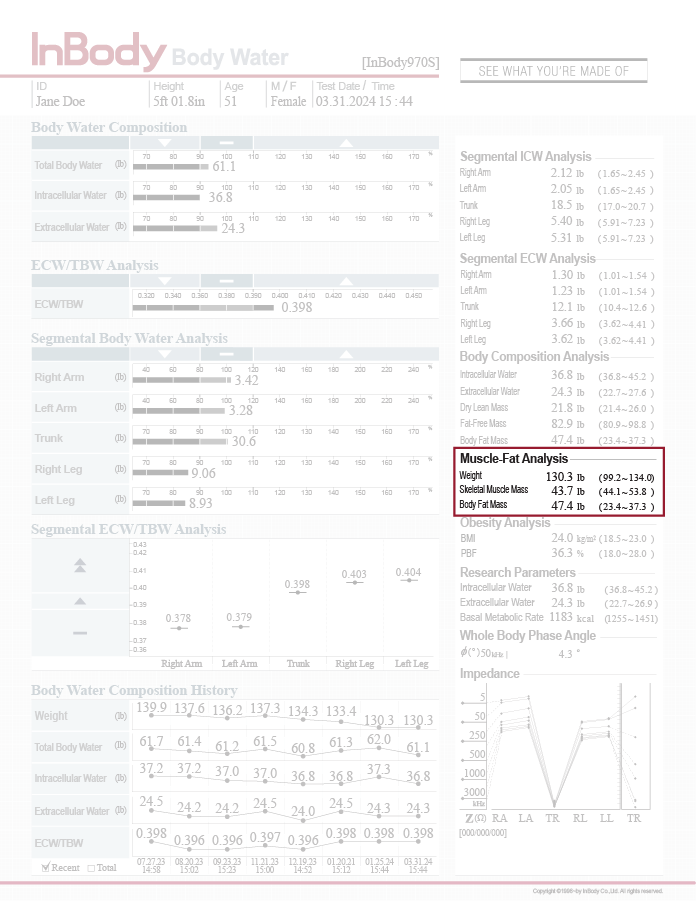
Muscle-Fat Analysis
This section shows how your Weight, Skeletal Muscle Mass, and Body Fat Mass compare to the healthy average range of people of the same height and sex. With Muscle-Fat Analysis, you get a better understanding of where your current body composition is so you can make any changes to get it to where you would like it to be.
Muscle-Fat Analysis is a favorite output for many people because it provides an easy-to-understand overview of body composition and helps narrow the focus of health goals.
Muscle-Fat Analysis has three components:
WEIGHT This is your Total Body Weight.
SKELETAL MUSCLE MASS (SMM) This is the total weight of your Skeletal Muscle Mass (SMM). SMM is muscle that can be grown and developed through exercise. Unlike Lean Body Mass, which includes everything except body fat, you can confidently interpret an increase in SMM as muscle gain.
BODY FAT MASS This is how much body fat you have (both the surface level and internal fat).
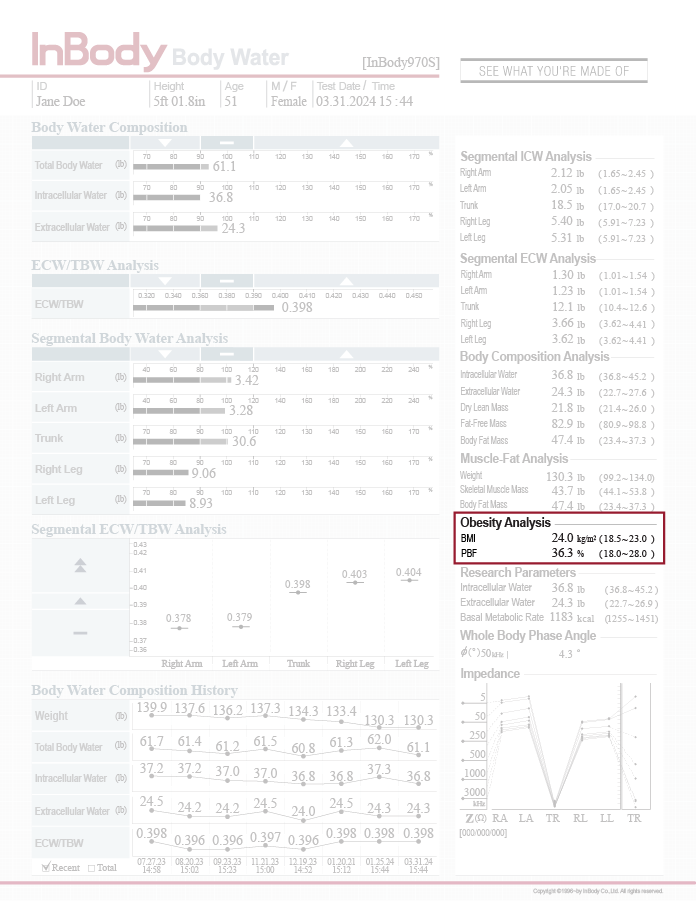
This section displays your body fat percentage, or Percent Body Fat (PBF), and Body Mass Index (BMI), as well as the healthy ranges for these measurements.
Body fat percentage is a division of your body fat mass by your total weight and a much better indicator of your risk of obesity than BMI.
Customizable Outputs
Obesity Analysis
Why you should focus on Body Fat Percentage over BMI
BMI is determined by dividing your weight by your height squared. BMI is just a single value that does not differentiate between fat or muscle mass. If you use BMI to track your fitness progress, you will never know if the changes were to fat or muscle.
BMI may also oversimplify health risks. Two people with the same height and weight would have the same BMI and health risks—even if one of them has a healthy amount of fat and high muscle mass.
On the other hand, PBF puts your weight into context by showing how much of it is fat mass. Tracking changes in your body fat percentage lets you focus on actual fat loss, not just weight loss, which can also come from muscle mass.
WHY THIS MATTERS
A graph like this can be a real eye-opener because it shows that negative body composition changes can occur if your weight remains the same or even decreases for the wrong reason.
When assessing your current obesity level and the associated health risks, use Percent Body Fat (aka Body Fat Percentage) because it reveals how much of your weight is fat. BMI is a poor indicator of obesity risk but is on the Result Sheet for reference purposes.
Customizable Outputs
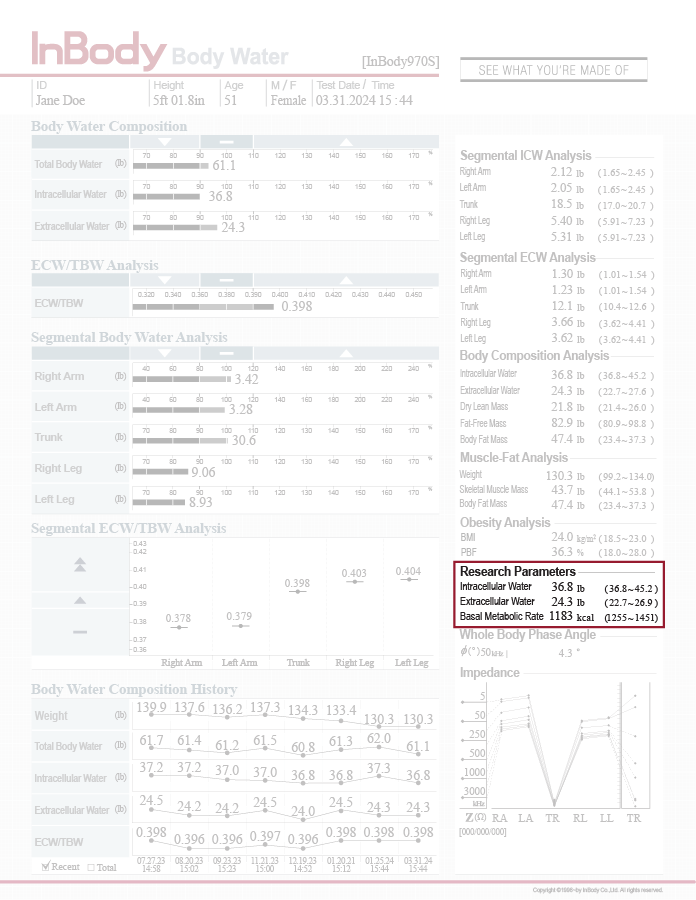
Research Parameters
The InBody 970S provides advanced body composition metrics in the Research Parameters section of the Body Water Result Sheet. Professionals use these outputs for research purposes and to further elevate assessments with additional actionable health data.
Customizable Outputs
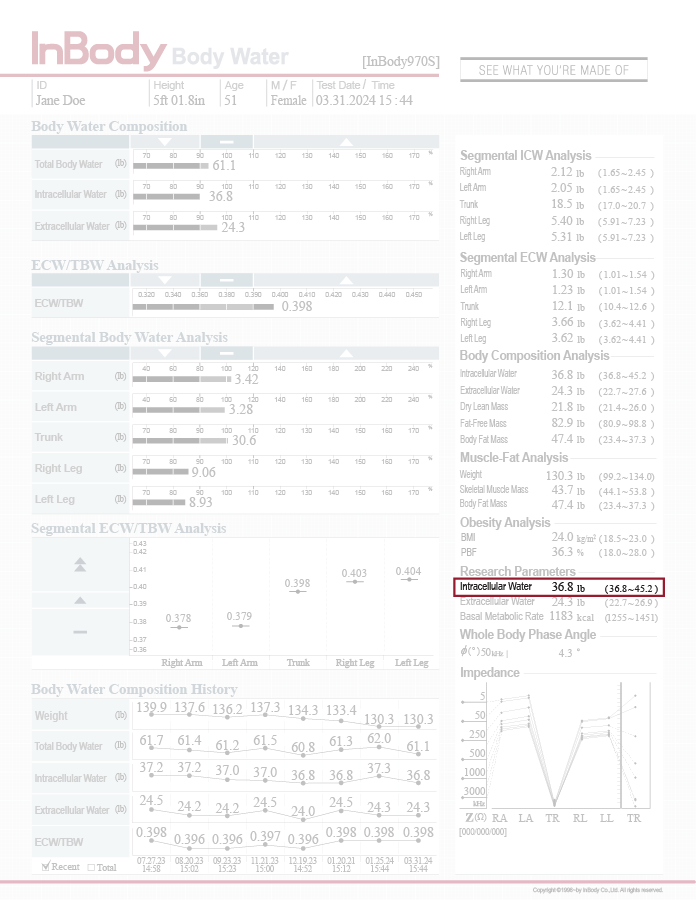
Research Parameters
Intracellular Water
Intracellular Water (ICW) is water inside of the cells (includes the water in the muscles, organs, and other body tissues). The numeric ranges in parentheses represent an average range for users of the same height and sex.
Customizable Outputs
Research Parameters
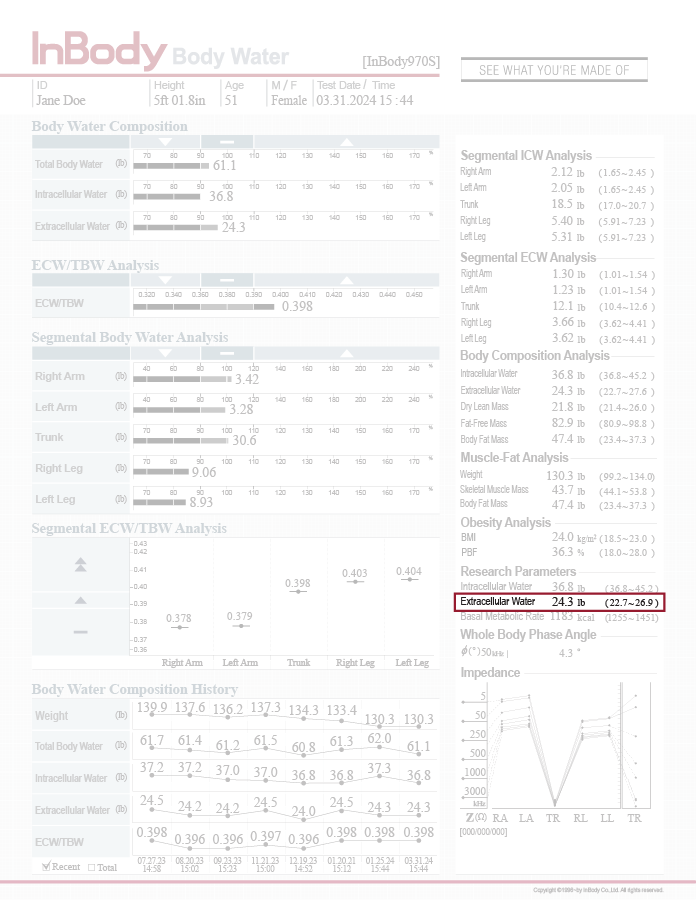
Extracellular Water
Extracellular Water (ECW) is water outside of the cells (included in the blood and interstitial fluids). The numeric ranges in parentheses represent an average range for users of the same height and sex.
Customizable Outputs
Research Parameters
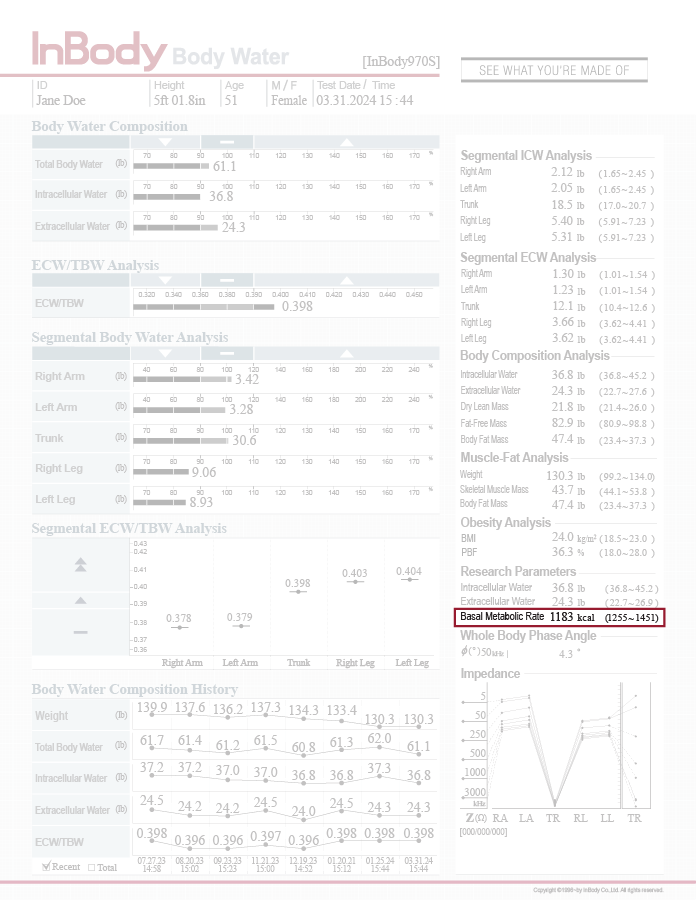
Basal Metabolic Rate
Many people don’t understand the principles of caloric intake and, when trying to lose weight, consume too few calories. Although this choice may be effective for weight loss, InBody devices show that a significant portion of what’s being lost is, in many cases, Fat-Free Mass.
WHY THIS MATTERS
If your clients want to change their appearance, it is ideal to increase their Basal Metabolic Rate (BMR) through muscle gain rather than calorie restriction.
Customizable Outputs
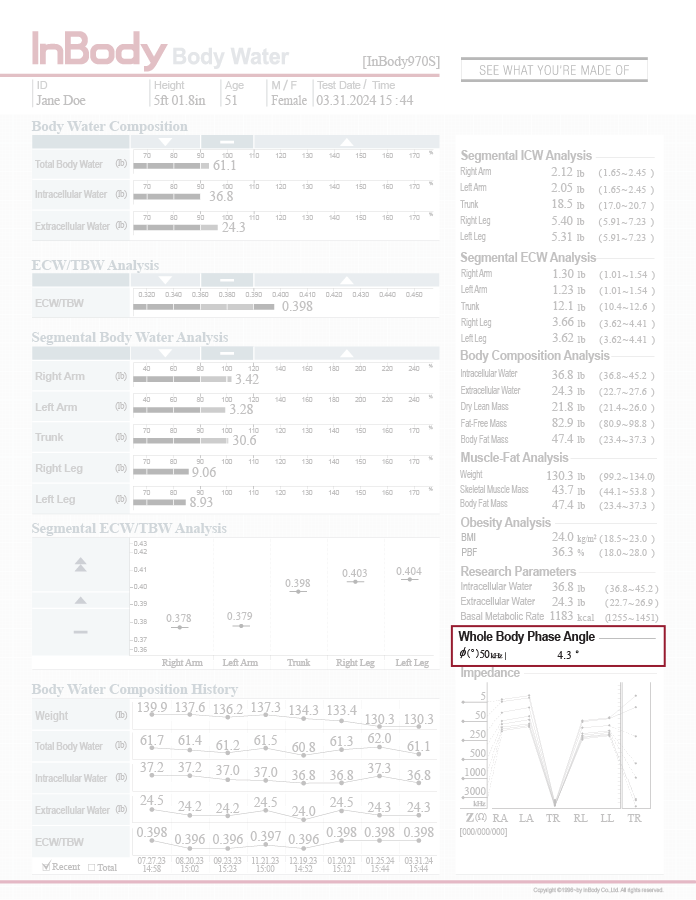
Whole Body Phase Angle
Phase angle represents the integrity, or strength, of cell membranes and can be a more sensitive indicator of health status when physiological changes are not apparent. Phase angle value fall between 4 and 6 degrees for women and 5 and 7 degrees for men, with a higher phase angle indicating higher cellular integrity. In athletic individuals or those with naturally high muscle mass, these values may be higher than the average range, indicating above-average cellular health. Phase angles that fall below the range are not necessarily indicative of poor health but should be monitored to ensure that they do not decrease progressively.
WHY THIS MATTERS
Tracking phase angle over time can help identify potential changes to cellular health that may be associated with disease.