

The InBody Result Sheet displays your body composition measurements in a clear, easy-to-read way to make understanding your results simple.
Below, you will find a concise breakdown of each section of the Result Sheet. You’ll learn what each measurement means, why it matters, and how it can help you be successful in your health journey.
* The information provided is to be used for educational/informational purposes only and does not constitute medical advice. Only certified medical & health professionals may diagnose patients and provide such advice.

Chapter 1
This section gives you a solid breakdown of your overall body composition, displaying these vital measurements in pounds (lb):
Let’s take a closer look at how to interpret this section and use it to determine if you’ve gained muscle or spot fluid imbalances.
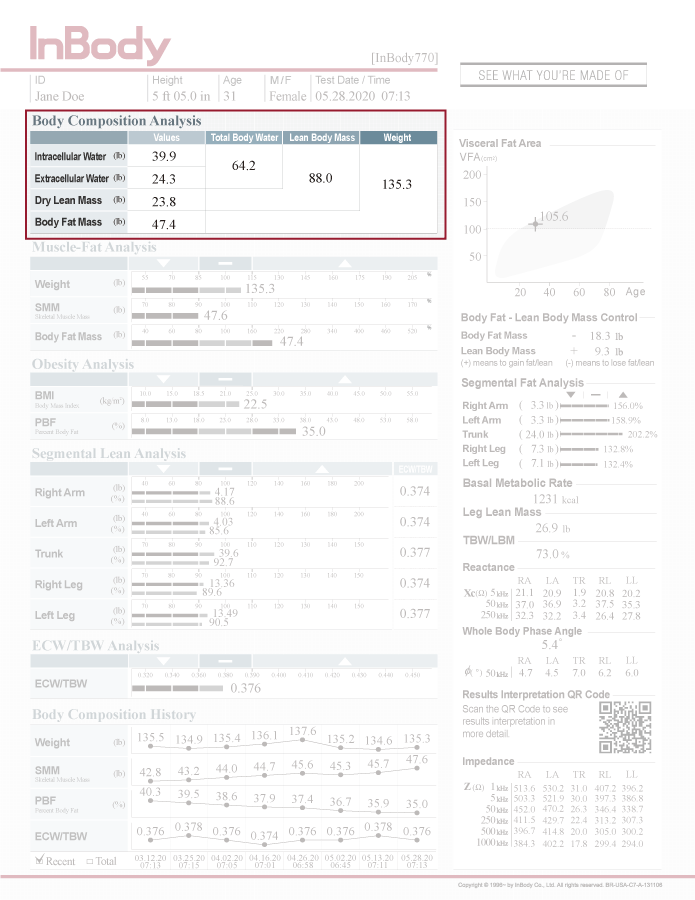
At the top, you have Intracellular Water (body water inside cells) and Extracellular Water (body water outside cells), which make up Total Body Water.
WHY THIS MATTERS
Both ICW and ECW are valuable in their own right, but monitoring Extracellular Water, in particular, can provide deep insights. If you notice an increase in ECW, but not ICW, this could be due to acute inflammation from overtraining.
This value is the weight of the protein and mineral content in your body.
WHY THIS MATTERS
Because protein makes up most of your muscle, and Dry Lean Mass excludes body water, if your Dry Lean Mass increases, then this is generally a sign that you have gained muscle mass!
Below Dry Lean Mass is Body Fat Mass. This value reveals how much body fat, both surface level (subcutaneous) and internal (visceral), makes up your weight.
Displayed in the second column from the right, Lean Body Mass (LBM) is the sum of your ICW, ECW, and Dry Lean Mass. LBM is the weight of everything in your body except fat; for this reason, it is also called Fat-Free Mass. Lean Body Mass includes muscle, water, bones, and organs.
WHY THIS MATTERS
Usually, increases in LBM reflect an increase in muscle mass (which you can also see as an increase in Dry Lean Mass) and is considered an improvement in body composition. However, people who do not maintain normal body water ratios may have increased LBM due to swelling caused by strenuous exercise or activity.
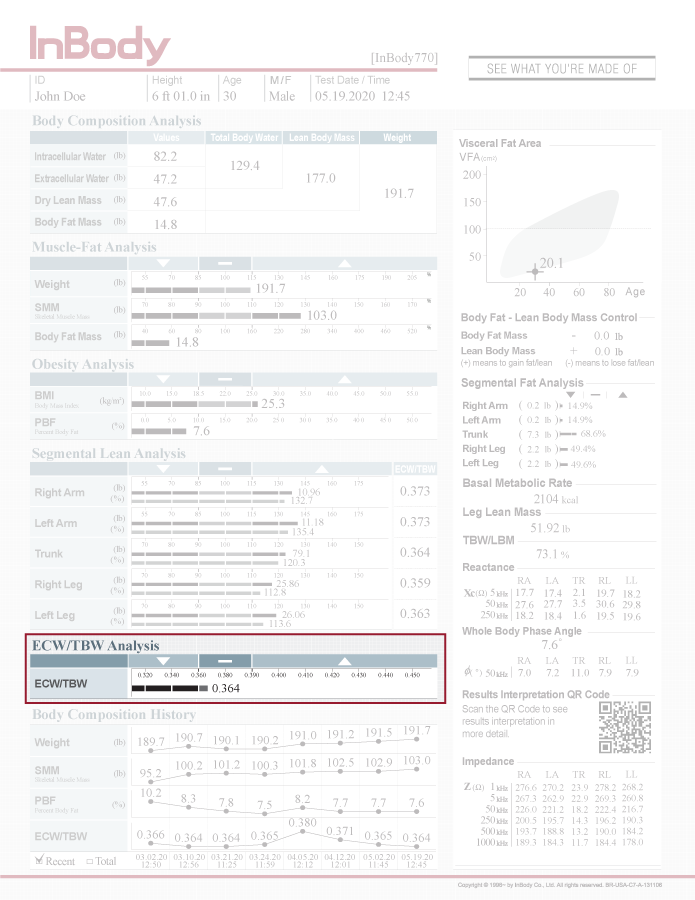
ECW/TBW is a measure of compartmental fluid distribution and shows, as a ratio, how much of your total body water is extracellular.
Taking multiple InBody Tests will establish your normal fluid status and help determine any imbalances. As a general guide, check to see that your ECW/TBW is below 0.390.
You’ll see minor fluctuations in your ECW/TBW—that’s normal. This output is primarily used to give context to another section—the Segmental Lean Analysis.
ECW/TBW to determine if the cause of the imbalance is due to fluid retention rather than muscular imbalance.
WHY THIS MATTERS
This graph lets you quickly understand if you have occasional inflammation or swelling in your body resulting from strenuous exercise or activity. You can also use this to give context to LBM. High LBM and a high ECW/TBW ratio usually indicate excess body water—not just muscle.
Chapter 2
This section shows how your Weight, Skeletal Muscle Mass, and Body Fat Mass compare to the healthy average range of people of the same height and sex. With Muscle-Fat Analysis, you get a better understanding of where your current body composition is so you can make any changes to get it to where you would like it to be.
Muscle-Fat Analysis is a favorite output for many people because it provides an easy-to-understand overview of body composition and helps narrow the focus of health goals.
Muscle-Fat Analysis has three components:
The Muscle-Fat Analysis also tells you whether you have a healthy balance of SMM and Body Fat Mass in respect to your weight.
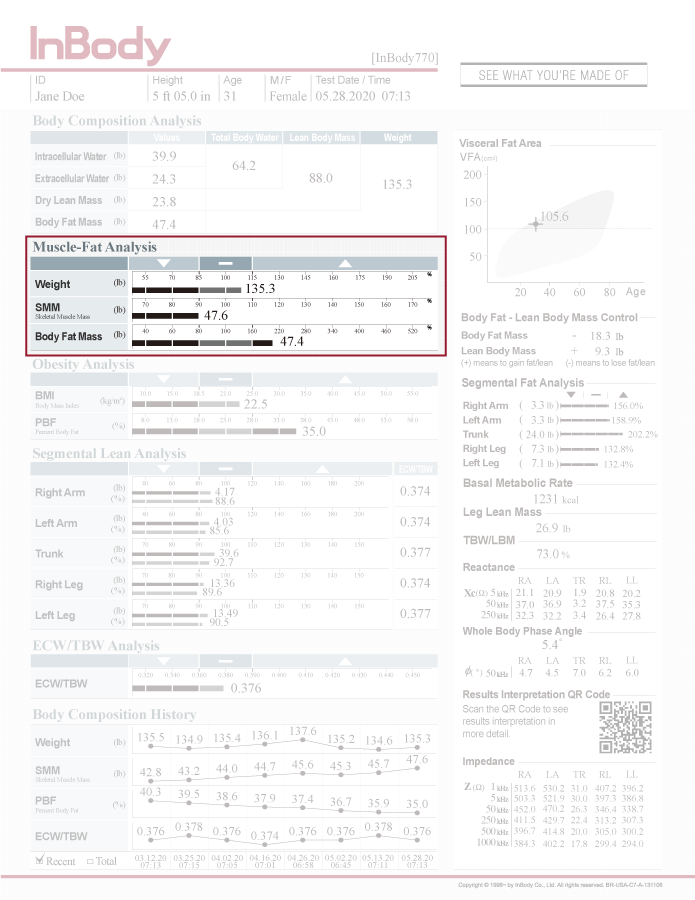
You can compare your measurements to others of the same height and sex with the percentages above the bar graphs. While the healthy range varies by output, the 100% mark indicates the healthy average for people of your height and sex. So if your Weight bar is at 130%, this would mean that your weight is 30% above average.
Similarly, if your Weight bar is at 70%, this would mean that you have 30% less mass than is considered the healthy average for your height.
How to find your body type using the C-I-D Method
Refer to your Muscle-Fat Analysis and connect the endpoints of each bar (Weight to SMM to Body Fat Mass) to form a C, I, or D.
Scroll down below to find out more about your body type!

If the length of the bar for your SMM is shorter than your Weight and Body Fat Mass, you have a C-shaped body type. Depending on where the measures are on the graph, this body shape can be characteristic of a person who is overweight, obese, underweight, or within the healthy range.
WHY THIS MATTERS

If the length of the bars for your Weight, Skeletal Muscle Mass, and Body Fat Mass roughly form a straight line, you have an I-shaped body type.
Although people with this body type are often at a healthy weight or body fat percentage, there are still areas they can focus on to maintain or improve overall health.
WHY THIS MATTERS
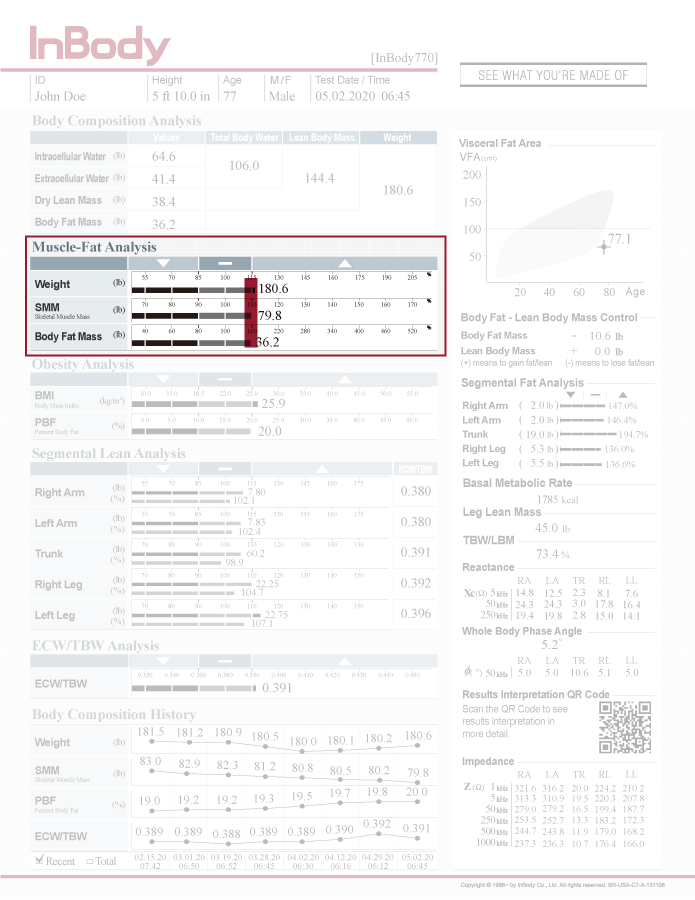
If your SMM bar is longer than your Weight and Body Fat Mass, you have a D-shape body type. Usually, this is an “athletic” body type that many consider the ideal body composition shape. However, if the Weight and Body Fat Mass bars are above the recommended ranges, you should reduce your fat mass to get into the ideal range.
WHY THIS MATTERS
If you want to improve your strength and physique, you should monitor your SMM and Body Fat Mass bars to ensure that SMM increases without a significant increase in Body Fat Mass.
If you wish to lose body fat and become leaner, you should monitor your Body Fat Mass while making sure you do not lose too much SMM. If SMM losses become too significant, make the necessary adjustments to your strength-training routine.

This section displays your body fat percentage, or Percent Body Fat (PBF), and Body Mass Index (BMI), as well as the healthy ranges for these measurements.
Let’s explore how Obesity Analysis can give you a better idea of your current obesity level and your risk of related health conditions.
Body fat percentage is a division of your body fat mass by your total weight and a much better indicator of your risk of obesity than BMI.
Let’s take a closer look at why PBF is a superior metric for assessing your obesity and overall health risks.
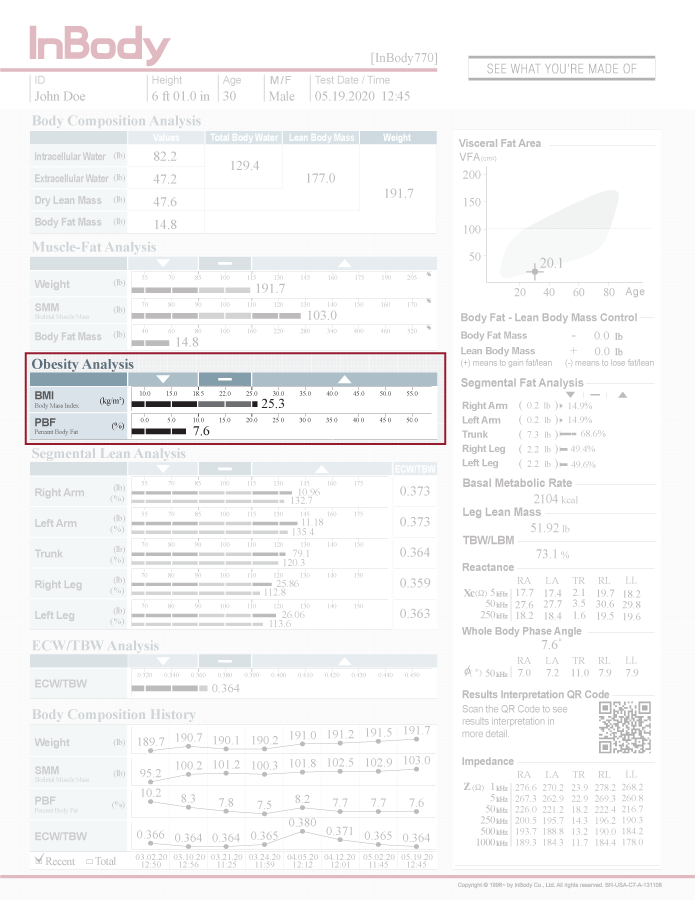
BMI is determined by dividing your weight by your height squared. BMI is just a single value that does not differentiate between fat or muscle mass. If you use BMI to track your fitness progress, you will never know if the changes were to fat or muscle.
BMI may also oversimplify health risks. Two people with the same height and weight would have the same BMI and health risks—even if one of them has a healthy amount of fat and high muscle mass.
On the other hand, PBF puts your weight into context by showing how much of it is fat mass. Tracking changes in your body fat percentage lets you focus on actual fat loss, not just weight loss, which can also come from muscle mass.
WHY THIS MATTERS
For BMI, 18.5 –24.99 kg/m2 is the healthy average range according to the World Health Organization. This healthy average range is presented on the Result Sheet, although the InBody device can be programmed to use a different range.
For PBF, the ranges differ for men and women, as women tend to carry more body fat than men due to their reproductive system and genetics. InBody calculates the recommended Body Fat Percentage ranges for men and women based on ACSM and ACE guidelines.
For men, the healthy range is between 10-20%.
For women, the healthy range is between 18-28%.
DIVE DEEPER
Read “Body Fat Percentage Chart: A Guide to Your Health Metrics

This graph displays some of the most vital measurements from your previous tests (up to 8). With Body Composition History, you can easily spot trends and track your progress over time.
At the bottom of the Result Sheet is the Body Composition History graph, which automatically tracks your Weight, Skeletal Muscle Mass, Percent Body Fat, and ECW/TBW measures from recent tests.
The purpose of this graph is to let you monitor positive and negative changes in body composition so you can adjust your diet and exercise plan to get the results you desire.
Let’s examine how to track positive and negative body composition changes by looking at the example above. These results represent an athletic, D-shaped individual whose goal was to gain muscle and lose body fat.
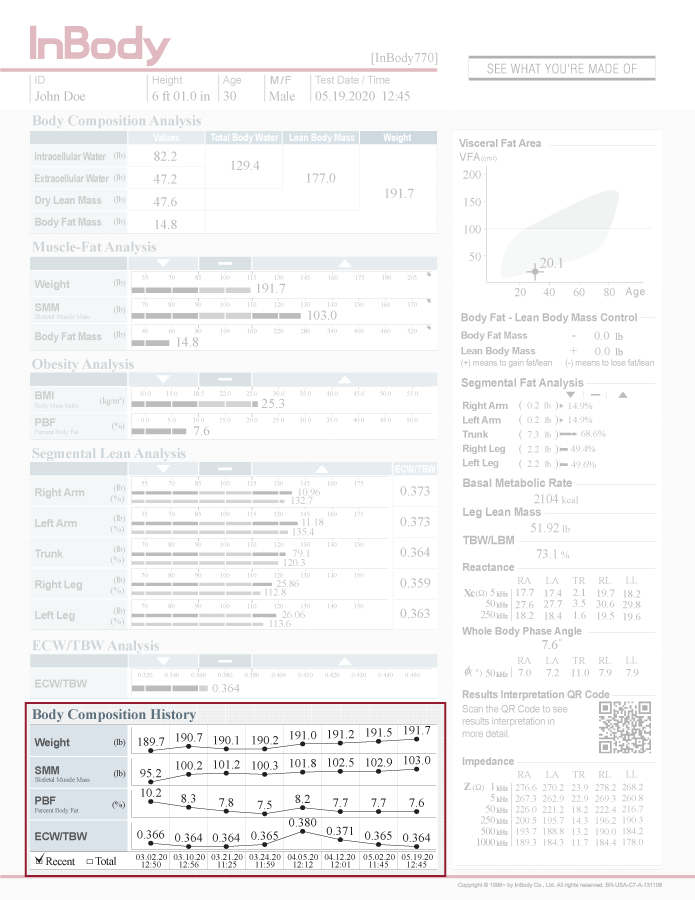
The Body Composition History graph makes it easy to spot when positive body composition changes occur. For instance, a gradual increase in Skeletal Muscle Mass and decrease in Body Fat Mass over the past few tests indicates that you’ve made excellent progress towards improving your overall body composition.
WHY THIS MATTERS
The Body Composition History graph also makes it easier to spot negative body composition changes. For example, a drop in body weight may initially appear like a positive change, but regular testing may show that this trend was due to muscle loss, not fat loss.
WHY THIS MATTERS
A graph like this can be a real eye-opener because it shows that negative body composition changes can occur if your weight remains the same or even decreases for the wrong reason.
If your graph looks like this, you need to retain your muscle mass with some combination of nutrition and strength training.
When used correctly, this is one of the most valuable sections of your InBody Result Sheet.
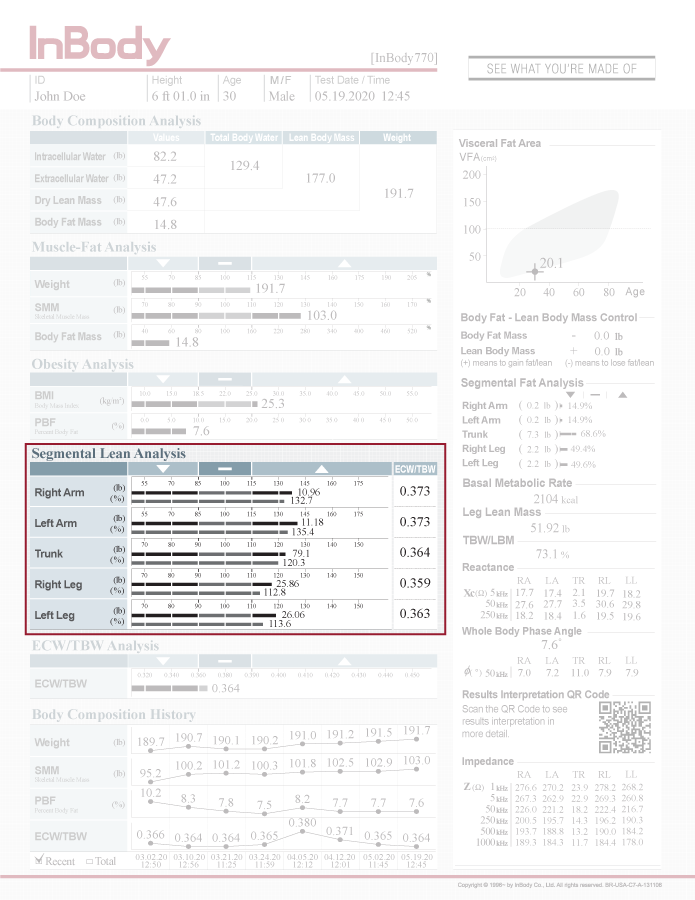
Segmental Lean Analysis displays your Lean Body Mass (Fat-Free Mass) in all body segments in pounds and its sufficiency to support your body weight as a percentage.
Interpreting your Segmental Lean Analysis can help you:
The InBody divides your body into five body segments: your arms, legs, and trunk (torso), or the area between your neck, arms, and legs. The data for each body segment is displayed as two bars.
TOP SECTION
The top value shows how much Lean Body Mass (Fat-Free Mass) you have in pounds for each body segment.
Just like with the Muscle-Fat Analysis, the top bar of the Segmental Lean Analysis compares the pounds of Lean Body Mass against the average expected amount of Lean Body Mass for your height. You should always work to be at 100% or higher.
BOTTOM SECTION
The bottom value compares your Lean Body Mass against your measured body weight, which helps you determine if you have enough Lean Body Mass to support your body weight, where 100% is sufficient.
WHY THIS MATTERS
Segmental Lean Analysis can help you see areas where you need to increase your Lean Body Mass. Achieving a more balanced, healthy body composition may have other positive effects, such as body fat reduction.
While any person can theoretically have an underdeveloped body segment, some groups may be at more risk than others. Here are a few populations who may have an elevated risk of having underdeveloped body segments:
1. Sedentary adults
Sedentary adults who do not exercise commonly have below-average Segmental Lean Mass typically in their legs, which may be due to having jobs that require sitting for long periods.
2. “Skinny Fat” individuals (sarcopenic obese)
People who are “skinny fat” have too much body fat and not enough muscle mass for optimal health. This muscle and fat imbalance can result in healthy body weight, often leading the person to believe that they do not need to make any changes.
3. The elderly
It is common for the elderly to have low Lean Body Mass due to their tendency to lose muscle due to decreased activity. Their ability to stay mobile as they age is impacted, putting them at greater risk of falling and breaking bones.
Muscle imbalances are relatively common in today’s increasingly sedentary population. People who have jobs where they sit down for most of the day tend to have a developed upper body but an underdeveloped lower body.
Another imbalance the Segmental Lean Analysis can reveal is the imbalance between your right and left arms and/or legs. This type of muscle imbalance can be due to many reasons, including a workout routine that focuses on one side of the body over the other.
WHY THIS MATTERS
If you have an upper and lower muscle imbalance, increase your LBM in your lower legs to reduce your risk of injury. On the other hand, if one side of your body has more developed muscle mass than the other, optimize your strength training to achieve a better balanced LBM distribution.
DIVE DEEPER
Read “Lean Body Mass vs. Skeletal Muscle Mass: What’s the Difference?”
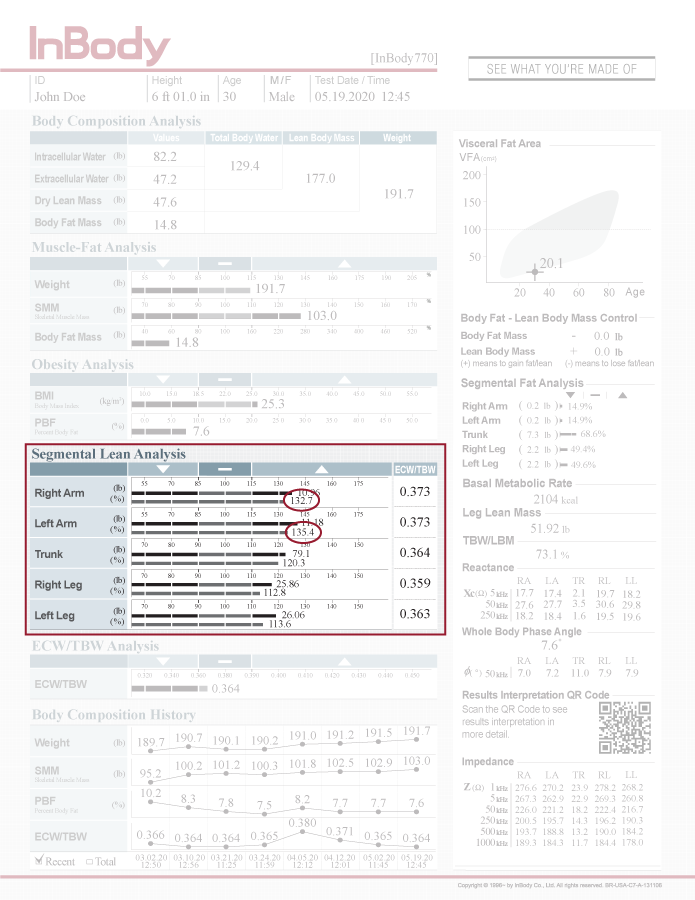
On the right-hand side of your Result Sheet, you will find a series of additional outputs. The InBody Test administrator can customize these outputs based on your specific goals.
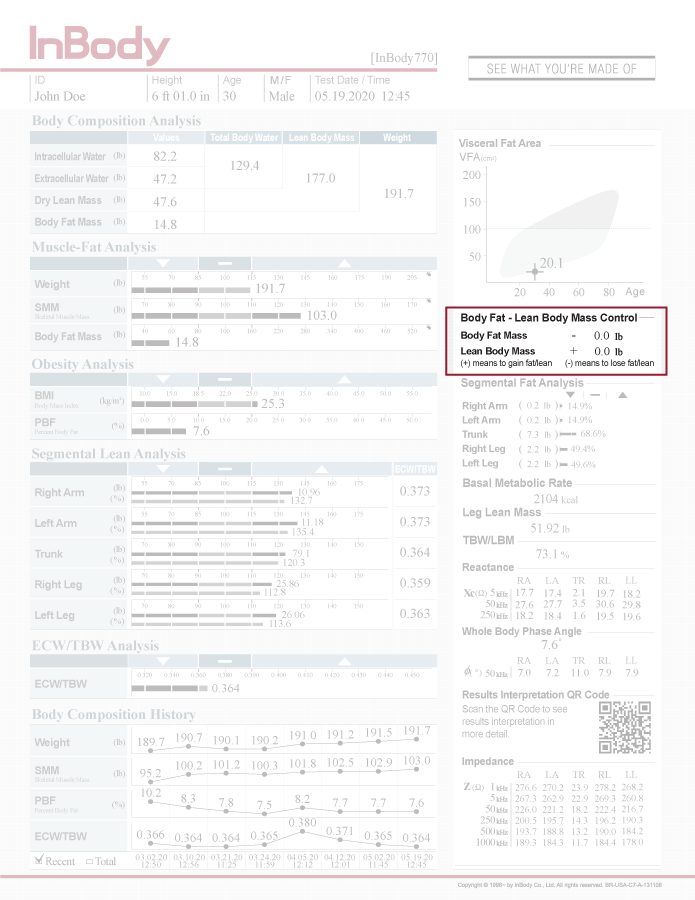
This section makes it very easy for you to set health and fitness goals and help you achieve the recommended body fat percentage for your sex (15% for men, 23% for women).
Depending on your current Muscle-Fat balance, this Result Sheet output will recommend adjusting Body Fat Mass and/or LBM to reach the target PBF.
If you have too much Body Fat Mass, the InBody will advise losing a certain amount of fat mass and maintaining or increasing LBM. The InBody will never recommend losing LBM.
WHY THIS MATTERS
In the example above, the person has 3.3 pounds of body fat in their left arm. For a person of their height and sex, that’s 158.9%, or 58.9% more body fat than the average person of the same height and sex.
WHY THIS MATTERS

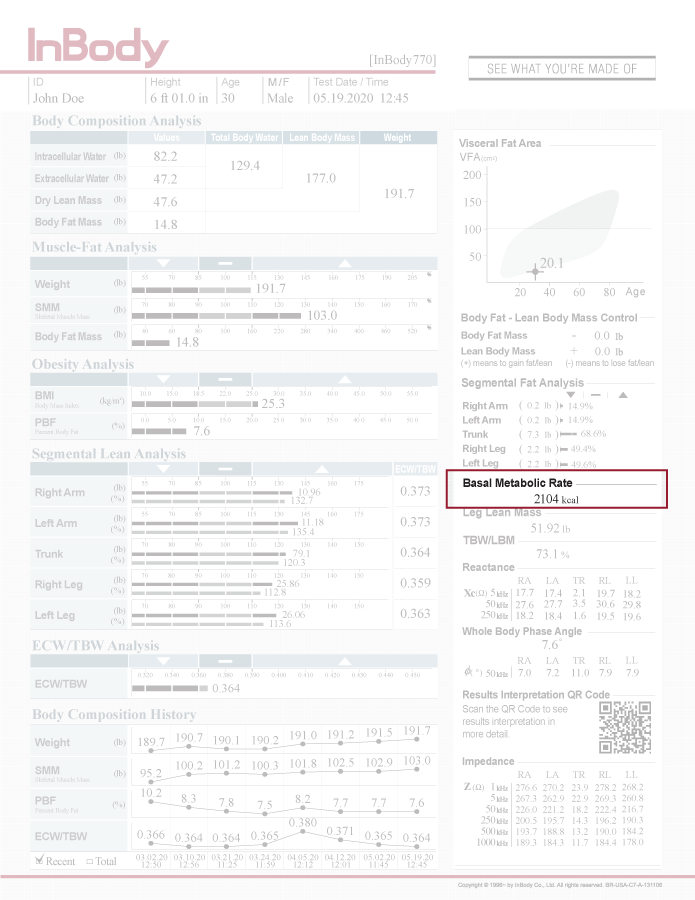
Your Basal Metabolic Rate, or BMR, is the total number of calories you need for your basic essential functions. This value allows you to work with your dietician to create a nutritional plan, which is key to reaching your body composition goals.
You may think that your BMR is the number of calories you should eat in a day, but this is NOT the case. BMR does not take into account any calories needed to perform daily activities, and so your actual caloric need for the day is likely much higher than your BMR.
DIVE DEEPER
Read “Metabolism 101: A Look Inside Your Body’s Energy Engine.
WHY THIS MATTERS
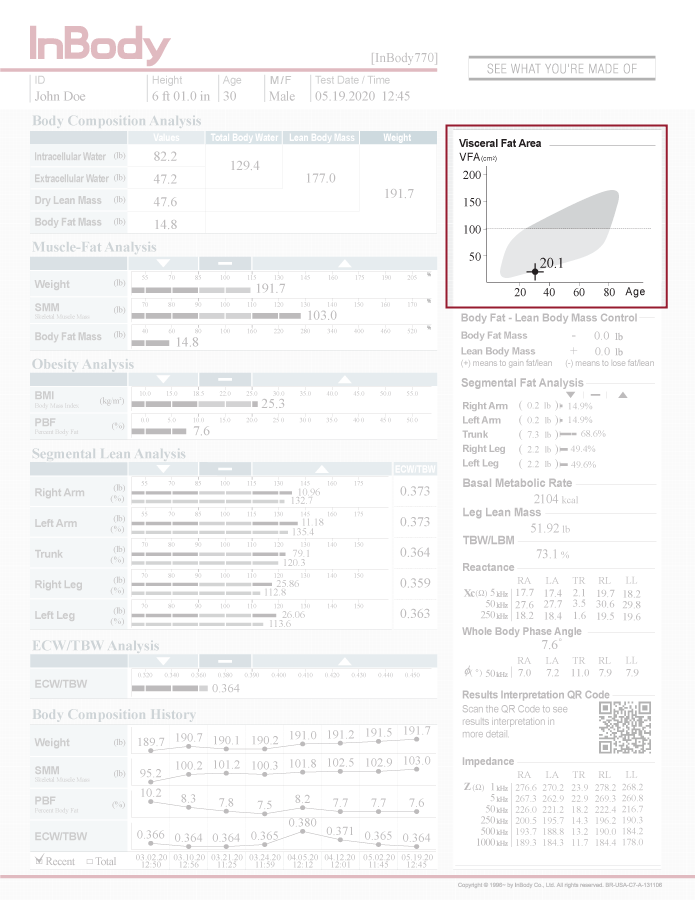
As you may know, there are two main types of body fat: subcutaneous and visceral. The Visceral Fat Area graph allows you to determine how much harmful visceral fat you have.
The graph looks a bit complicated but is actually quite simple to read. The “100” on the left side of the graph represents 100 cm2 of the visceral fat area.
Try to stay at or below this line to maintain a healthy fat balance.
WHY THIS MATTERS

How to read, understand, and use the InBody Result Sheet for your business.


Download our e-book and learn about the importance of a healthy body composition for the immune system


